

Latest Comments

Guest - Aislinn Dyestuff Citizen Science.
09. Oktober 2026
This is a great project. I look forward to the results. Thanks for letting us know.
Guest - Aislinn Time for...
09. Oktober 2026
Looks delicious!
Guest - Katrin Sprang Discussion
18. September 2026
Hi Rachel, I have looked for more photos of you, but that was not very successful. I found a link on...
Guest - Beatrix Sprang Discussion
15. September 2026
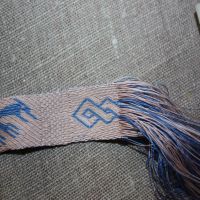
That lozenge pattern element is not a photograph, but a scan. So it should be to scale. But I pinned...
Guest - Katrin Sprang Discussion
15. September 2026
I was not referring to Rachel's reconstruction (is the reconstruction you refer to the one photograp...
FEB.
14
0

This is what happens when schedules are not kept.

I got up earlier than usually today and then sort of got gobbled up by lots of different small tasks (and lots of phone calls) - to the point that I totally forgot I had not blogged yet.

So, with ample delay, here's today's blog post...

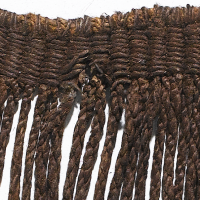
You might remember the spinning for the Hallstatt narrow wares reproduction quite a while ago? This has been covered by the Standard, an Austrian newspaper, and the little (German) article is online as well - you can read it here. There's also a special exhibition about the project at the Naturhistorisches Museum Wien, and I'm looking forward to seeing it when I am in Vienna for the 3000 years of colour conference. So much nice stuff coming from that project!
0
FEB.
01
0

Friends are the awesomest thing.

Since I had some more little troubles with xmgrace yesterday, I used the Phone-a-Friend Lifeline and did just that. And thus got myself a nice little one-on-one, flesh-and-blood Grace tutorial.

Where I learned the following Two Rules for Getting Grace:
Rule one: If plotting or importing data does not work, you probably have a dumb user problem and screwed up your dataset. Which is easy to do - just add a line break at the wrong place, or leave a string in.
Rule two: When working with grace, pretend it's a jump-and-run game or an egoshooter - save early, save often, save lots of different versions. Grace has no undo function, and hitting the wrong button (or even the right button) at the wrong time can permanently screw up things.

I'm not sure whether there's a third rule - insist on grace being totally cool and a very good tool no matter how much trouble it can make - but I will find that out (probably).

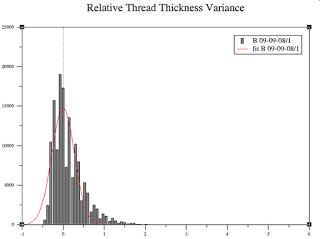
For now, though, I know how to get stuff like this:


so I'm perfectly content.
0
JAN.
31
0

Oh Grace.

My computer has now successfully turned into a schizophreniac computer - it can run Windows and emulate UNIX too.
Now I only need to get xmgrace running properly (there are still some issues with my data import), and I can finally get those graphs with Gauss fits that I need for finishing my evaluation, and thus my article, and thus my preparation for the next paper (I will speak at the 3000 years of colour conference).

It's probably best that I have no clue at all anymore as to how much time I have invested in the spinning experiment. When I started out with this, I did not believe this would become such a huge item in my life. (I know what I would do if I had to decide again whether to do it or not, knowing how much would come after it. I would say... YES.)

So... please excuse me while I reboot my computer and try to find out where the issue is... and then hopefully finally get those histograms.
0
JAN.
27
2

Statistics, statistics.

It really, really is amazing what one can learn (and has to learn) just because of some spinning. I have learned on Thursday last week that Excel will find the median of a list of numbers by... choosing the value in the middle of the list. Which means that instead of finding the statistical median (half of the values are larger than this number and half of the values are smaller than it), it finds the number in the middle of a list. Thank you, Excel, I could have done that myself. By placing a simple link to the cell in the middle of the list. Because yes, I can count! So I worked on a little more, using the average instead, and grinding my teeth (figuratively speaking only, though).


In case you do not have your own version of a spinning experiment that you need to evaluate and analyse, and have no clue what I'm talking about: the average is made by summing up all numbers in a dataset and then dividing it by the amount of numbers. The median is the value in the middle of the dataset. Why do I want the median instead of the average? Median is way less vulnerable to outliers in the data. Case in point - let's assume we have a list of values that goes 1, 2, 3, 4, 100. Average is (1+2+3+4+100) divided by 5, which is 22. In contrast to this, the median of the same dataset is 3.

And Friday morning, I had a little private time with Mr. Google again, and I found out that yes, you can force Excel to get the statistical median. You can tell it to find the x-largest number in a bunch of cells. Which means that if you know how big your list of data is (I do) and see if it's an odd or even number of data (I do) and, if it's even, can divide said number giving the length by 2 (I do) and can make Excel calculate an average (I do) you can tell it to calculate the average between the two numbers in the middle of the list. Gotcha.

Oh, and I need the median... because after some fiddling and trying out and looking at data and getting brain-dead and trying something else, the most patient husband of them all and me came up with a possibility to give relative variations of thread thickness. Which uses a simple formula built around either the median (good) or the average (not quite as good). And now please excuse me while I try to get my now nicely-sized histogram bins into a good graph form.

Which will include giving my computer a split personality - because the programme I plot to do my plotting with is only running on Linux machines.
0
JAN.
18
2

Image Tweaking.

It really is amazing how much time a single small macro can gobble up.

Especially if, when you are almost through, you decide that the process might be even better suited to the aims if done a little differently. Because it does make a difference whether you run a median filter first, or whether you filter out outliers first, or make a transformation to binary first and run filters later on.

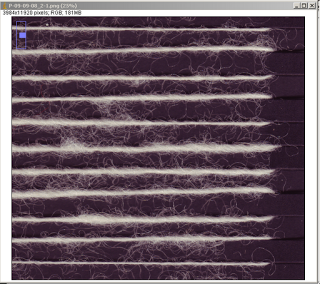
Anyways, I now have a method to turn a scan of thread samples like this:

into this:


and then read out the thread thickness of every single one of these threads.

Now I only need to wrangle the gazillions of datapoints into something resembling histograms or some other form of legible visualisation. And be amazed again at how much time a single little spinning experiment can eat.
0
DEZ.
14
2

Hah! or not Hah!, that is the question.

I may or may not have found a way to consistently and quickly measure both the diameter of hand-spun yarns and their thickness variance. With no highly specialised tools for textile analysis.

Actually, with very few tools at all.

I will know whether I can go "Hah!" in joy about that once I have bent my mind around the working functions of one or a few picture analysis programmes... and then I'll tell you all about it.
0
DEZ.
13
0

Still busy.

Things are still busy here, and a good bit of that is due to a bit of additional research I'm doing on the Spinning Experiment data. And totally related to this, we have figured out most of the things we needed to figure out for the next Textile Forum, and I will be working to update the website during one of the next days, and writing the call for papers for the Forum.

If you are already thinking about it: We will be in Mayen, Germany, from September 10 to September 16, and the focus topic will be "Metal in Textile Crafts". Stay tuned to learn more about it soon!
0

By accepting you will be accessing a service provided by a third-party external to https://pallia.net/

Kontakt